How to use Console Logging to debug ConnectUC Issues
If a users is experiencing issues, but is unable to navigate to 'Report an Issue', you can diagnose potential issues by viewing the browser console log.
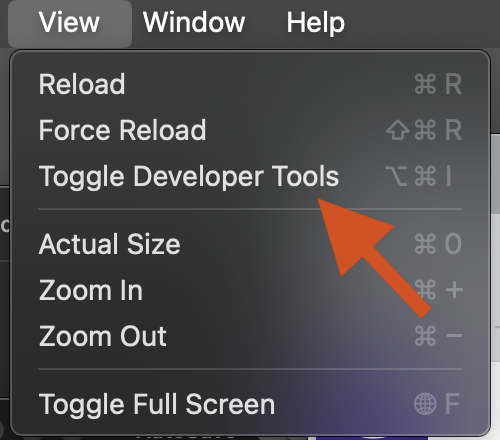
Turning on Console Log - Desktop Client
Click on 'View and then select 'Toggle Developer Tools'.
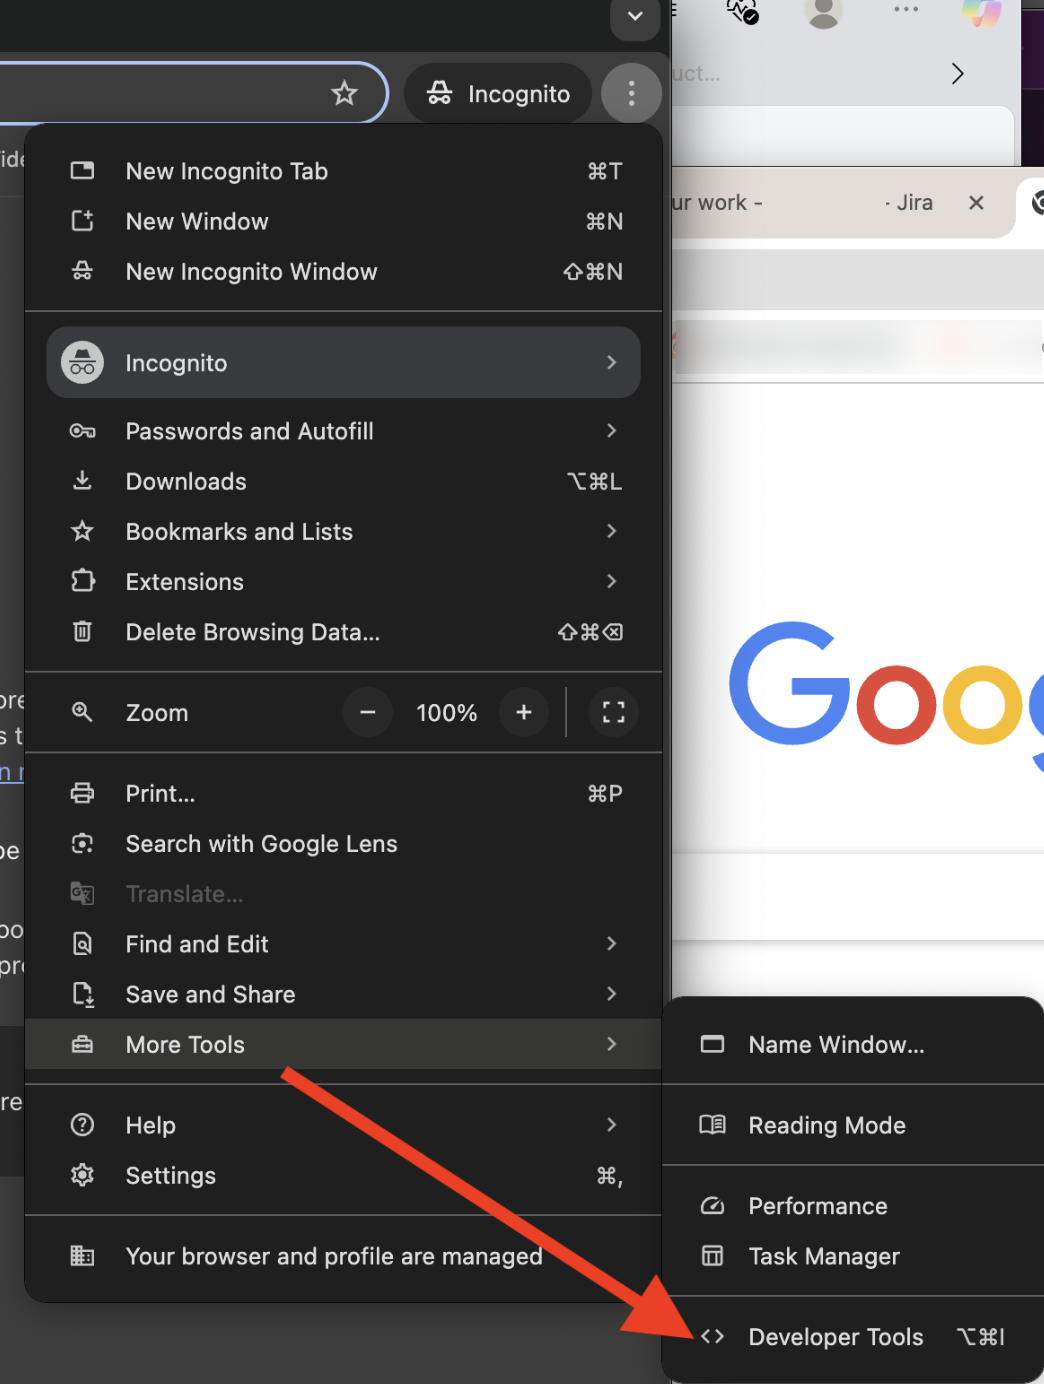
Turning on Console Log - Web Client
Click on the three button menu (...) in upper right corner and select 'More Tools' and then 'Developer Tools.'
Accessing The Developer Tools Console
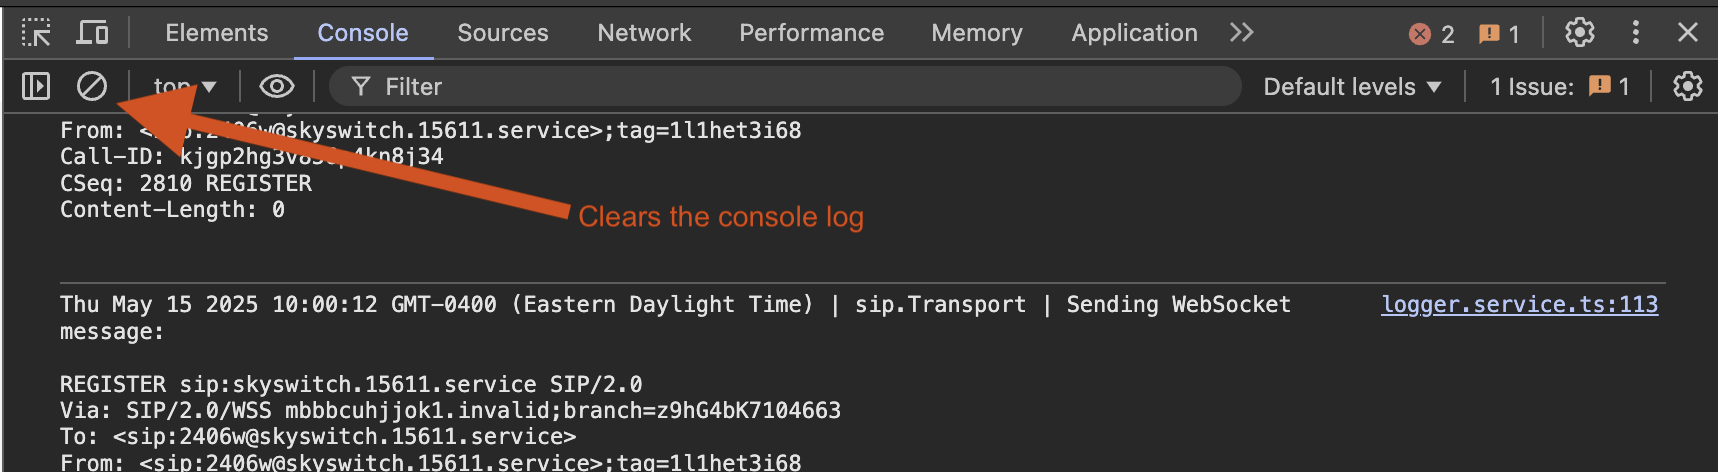
Select the 'Console' tab at the top of Developer Tools.
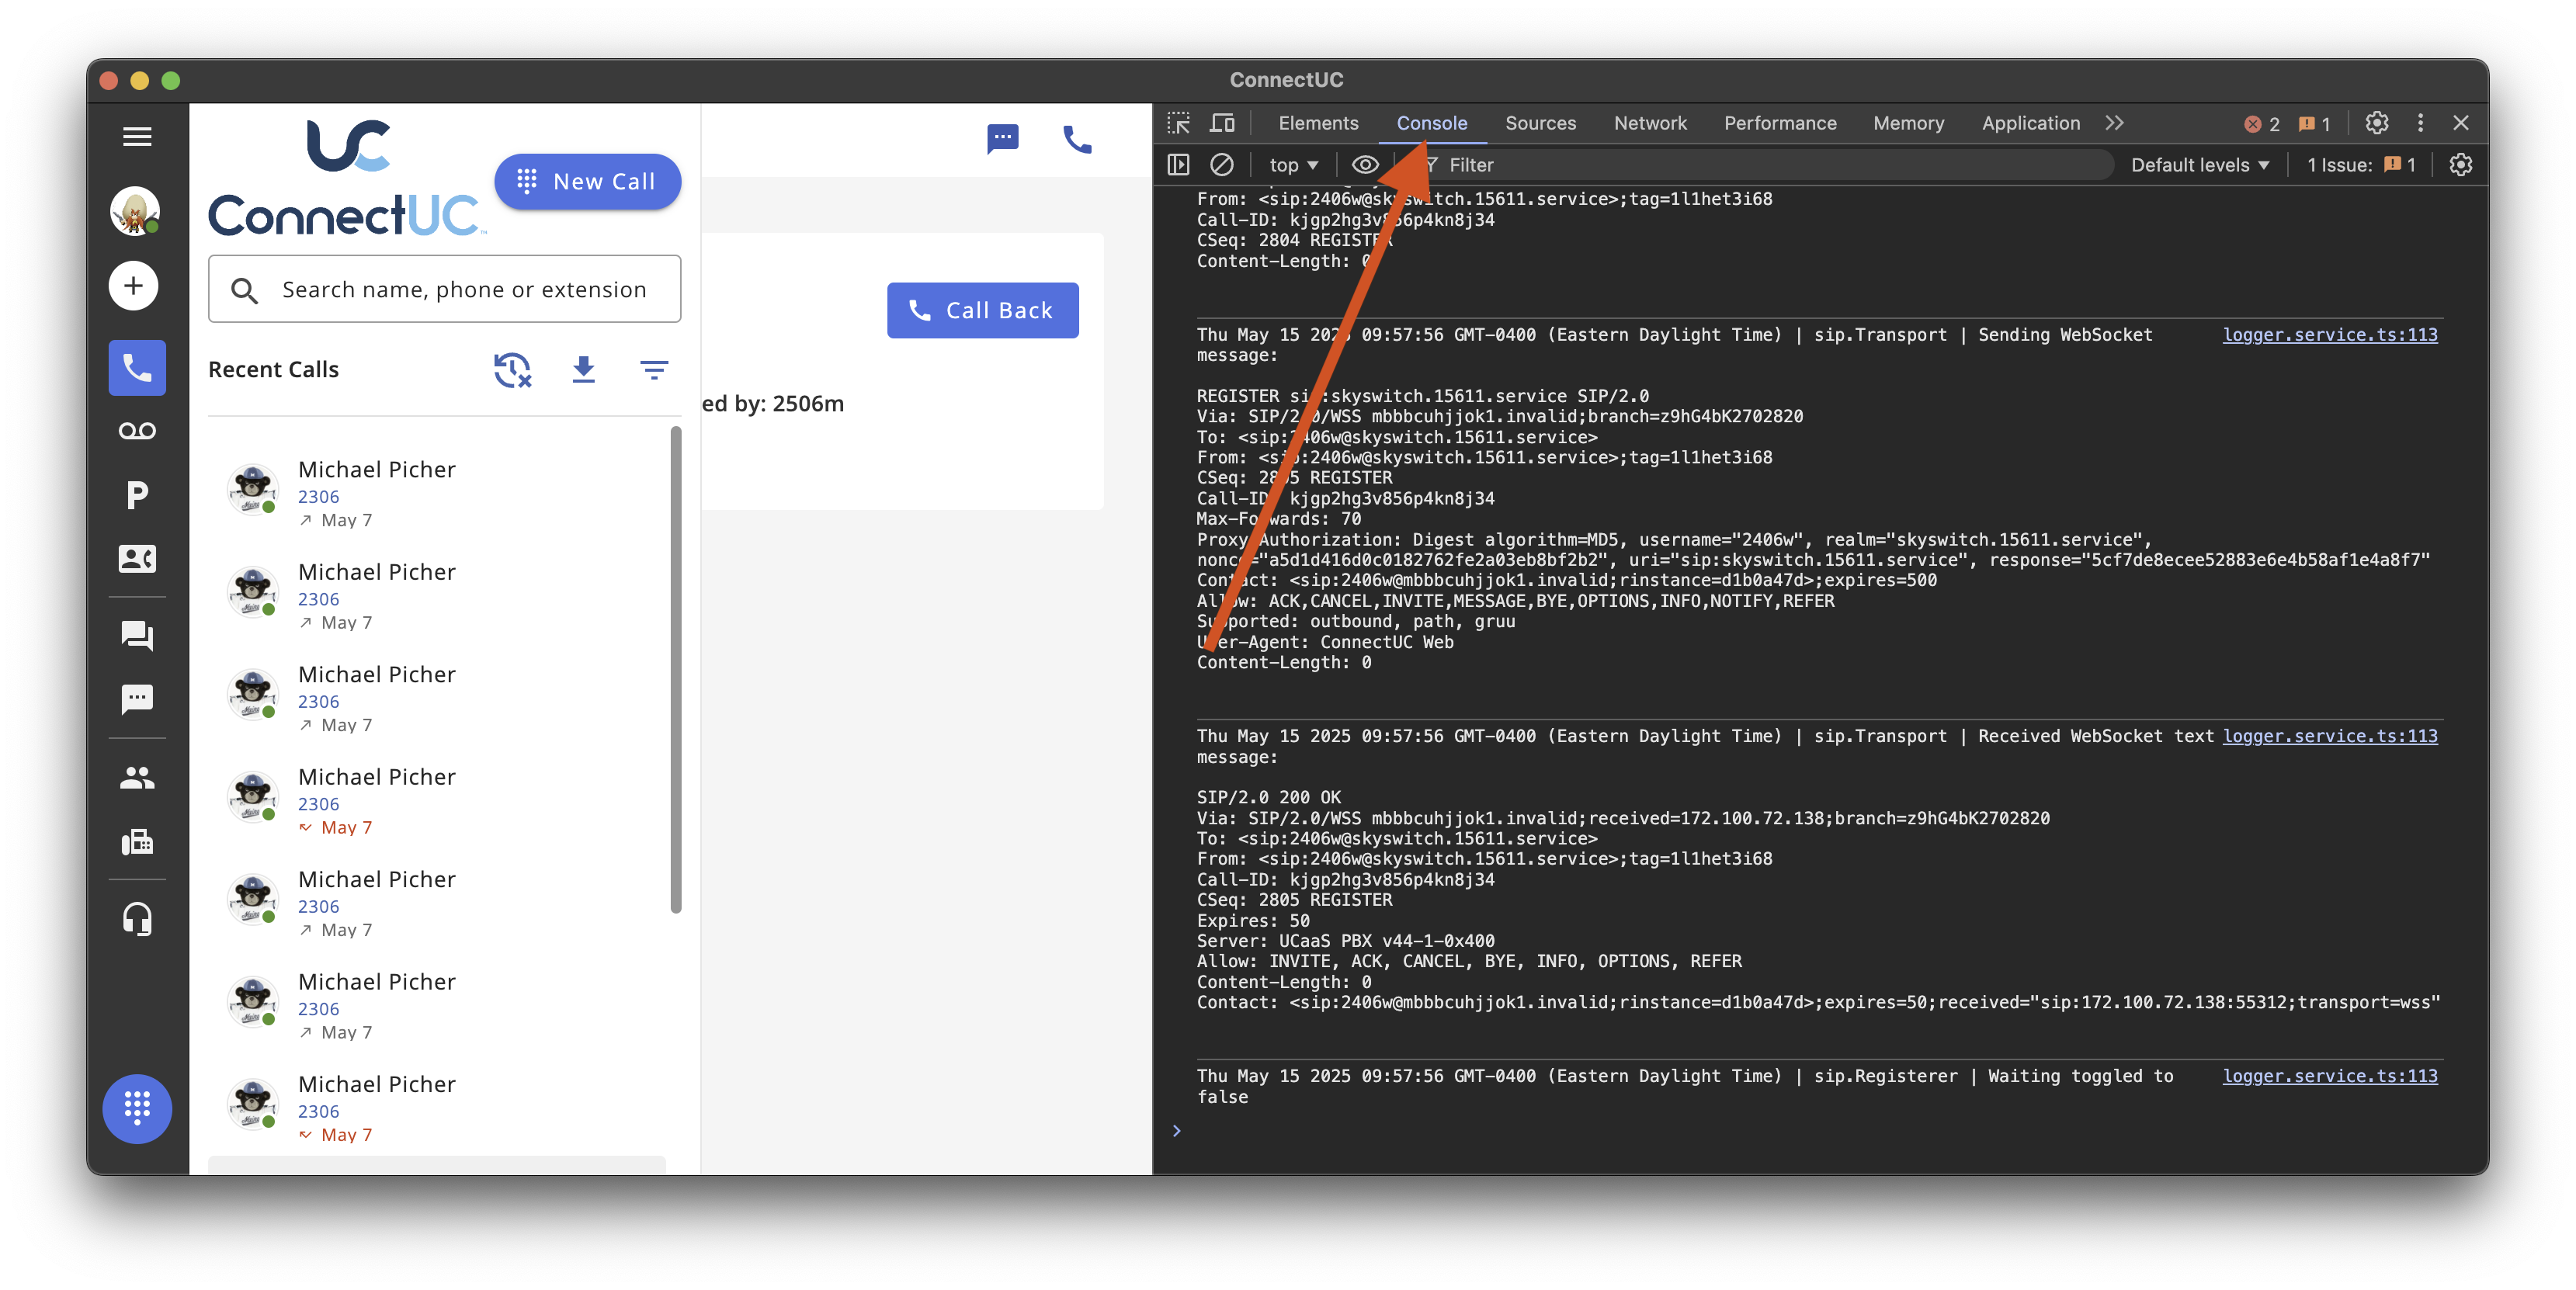
To capture a potential issue clearly, it's a good practice to clear the console log first and then re-create the issue by either refreshing the page or reproducing steps to recreate the issue.
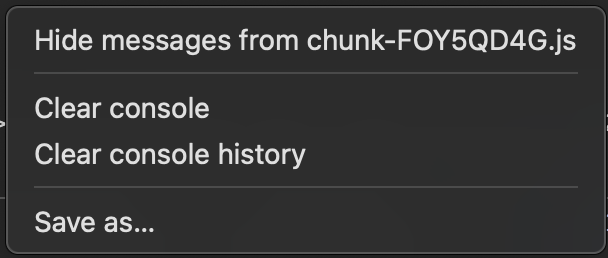
Saving the Console Log
To save the Console log to a text file, Right click in the log area and click "Save as...".